|
Idea Generation: Time Warner (TWX) has been shortlisted using our "Event Driven" quantitative screening on the back of several reasons: hidden assets in balance sheet, SOTP undervaluation and speculative M&A opportunities. See below a summary of the main points from the in-depth research for this long play. The company: TWX is the third-largest U.S. entertainment company with interests in TV networks and films. TWX has reduced its ad exposure by spinning off its Time Inc. magazine unit, and is driving affiliate fee gains thanks to HBO, as well as with TBS and TNT ranking among top cable networks. Ticket sales at the studio have averaged $4.7 billion annually since 2010. 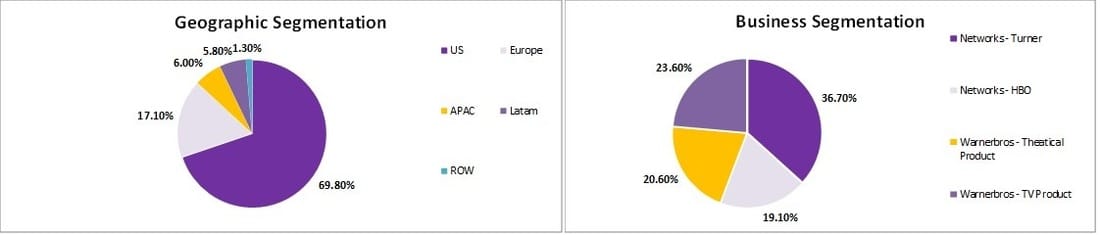 Investment Rationale
Risks:
Key Insights Earnings momentum picking up TWX posted better than expected 4Q results boosted by its HBO and Turner cable channels, but revenue slipped after its Warner Bros film studio did not release a big hit discounted by consensus triggering some sell-off intraday. Nevertheless, TWX also raised its 2016 profit forecast, saying it expected adjusted earnings of $5.30 to $5.40 – above analysts’ expectations of $5.26 – and all three operating divisions increased revenue and profits reflecting a healthy operating momentum across the board that will help to build earnings momentum within the next six months. Profitability bottoming-out Stable Gross Margin and improving bottom-line profitability (Operating Margin 21.7% vs 21% FY13 vs 20.5% FY10-14). ROE stable as turnover and profitability gains have offset lower leverage effects. TWX operating margin is in-line with the entertainment industry average but below peers like Viacom and Discovery. The most important thing is that all the businesses are pulling the leaver allowing gross profitability to bottom out and reach an inflection point in the last couple of quarters. 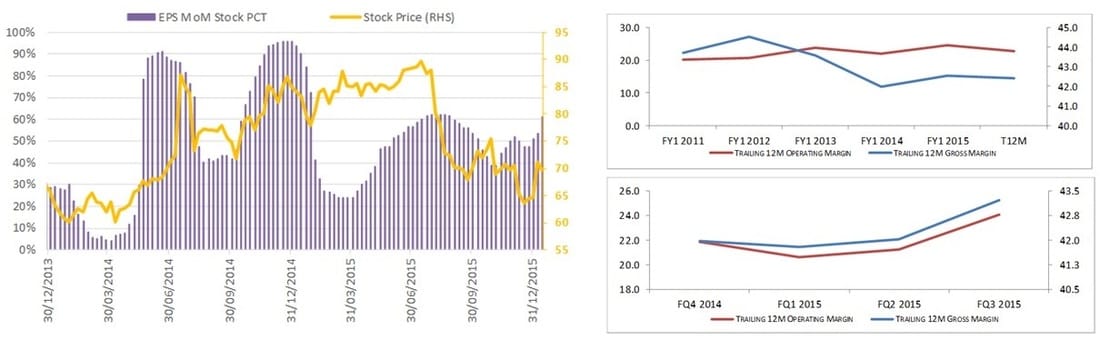 Credit Risk is low Liquidity is not a concern as the company shows enough room to maneuver with 3.6x Dividend Coverage and 5.7x Interest Coverage. The company credit profile is conservative: Debt-to-Equity below 0.4x (S&P average well above 1x) with Moody’s retaining a BBB rating with stable outlook. Increasing Quality and Cash Allocation EVA (Economic Value Added) has improved over the last couple of years, especially after TWX disposed of the loss-market “Time” business, and entered positive territory (4.2% vs 1% Average FY10-15). Earnings quality is reasonable (CFO/Net Income 1.1x) and cash flow generation metrics like CFO-to-Sales also show a remarkable stability and improvement over the last couple of years (14% vs 12.5% FY10-15). Only soft spot is to be found in the big amount of intangible assets: Goodwill as percentage assets is significant (43% vs 40% Peers), yet this is a common feature in the industry and there are no signs about material deterioration in TWX’s intangible assets. 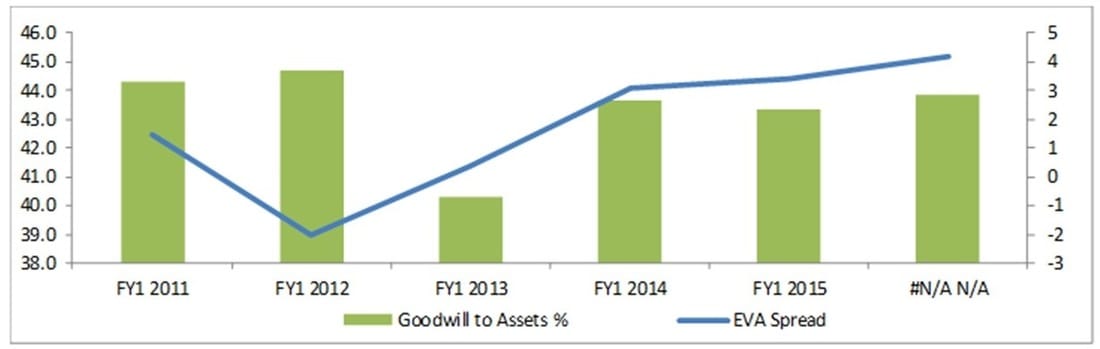 Cheap valuation when considering hidden assets There's clear value hidden in TWX balance sheet:
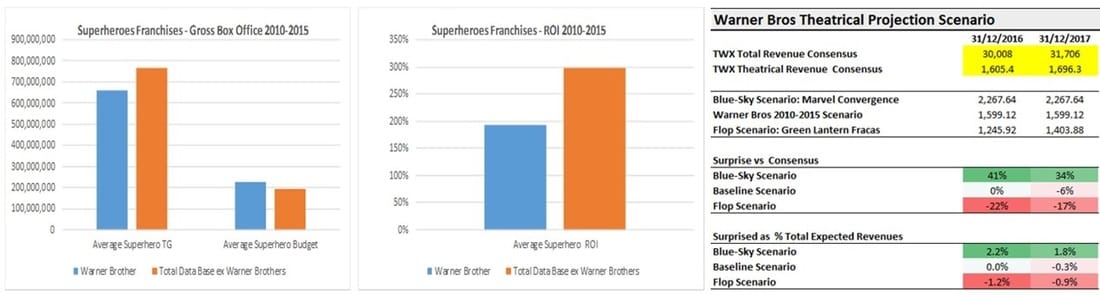 A simple and quick valuation comparison to peers points out that TWX is pricing a relative discount close to 15% when comparing current and average premium/discount levels to the industry median over the last five years. The results were encouraging also when checking valuation multiples against itself such as T12M PER. The chart below links TWX stock price levels and multiple PE percentile bands that confirm a valuation level close to TWX’s historical median. A conservative valuation using DCF analysis ad a reasonable set of inputs and checking sensitivities to different long term growth rates and cost of capital levels yields a fair value range within 85 USD. Including HBO's and DC's hidden assets value against current market implied valuations may boost the expected return well above 90 USD or +30%. To sum up, TWX technical indicators are in upward reversal mode, which should be of help to unlock the fundamental case behind the stock based on improving earnings and operating momentum, hidden value in assets and extremely bearish estimates. Disclaimer: the blog is intended to convey investment ideas and, market views , yet they are not a solicitation or recommendation to buy/sell/hold securities but merely investment ideas that should NEVER serve as the basis of the reader trading decisions. This website and its reports are for general information purposes and any investment decision should be discussed with a financial adviser before taking place. The investment ideas displayed here could have been implemented at an earlier date than the one stated at the blog's post date; for which reason the latter dates do not represent accurate and timely entry/exit points in order to protect those investors with whom the blog author has a fiduciary agreement.
0 Comments
Leave a Reply. |

Carlos Salas
LINKS Data Science & ML NYC Data Science Blog Data Science Central Towards Data Science Kaggle Blog Analytics Vidhya Quant Finance Quantocracy MoneyScience QuantStrat Trade R Investments Market Screner Macro Calendar Corporate Calendar Advisor Perspectives Trading Economics Portfolio Visualizer Datasets Opendata Data.Gov World Bank Quandl |
 RSS Feed