 Blend" is a series of posts with specific stock conviction cases showcasing how to combine multiple investing disciplines (machine learning scoring/screening, fundamental analysis, forensic accounting analysis, behavioural finance, corporate finance, alternative data) to generate differentiating alpha-generating ideas. Short Idea Key Takeways: IBM is a structurally challenged story featured by product cannibalization (cloud migration), buzzword promises (AI, Blockchain, etc), accounting red flags and a weak turnaround story rooted in an expensive M&A deal motivated by fear to miss out that has increased significantly IBM’s credit risk just before Covid19. Consensus bullish rationale hinges on hopes of finding a turnaround story similar to Microsoft. Regrettably, IBM is a value trap with more to do with other failures like Symantec, Microfocus or HPE. Hybrid Cloud and the Red Hat acquisition are not game changer moves. Red Hat’s acquisition has been labelled as “gamechanger” as will allow IBM to gain exposure to the hybrid cloud niche with expected CAGR +17-21% from ~$40bn to ~$140bn by 2025 (source: multiple consulting firms). However, the “gamechanger” narrative is fragile when faced with the next facts and red flags:
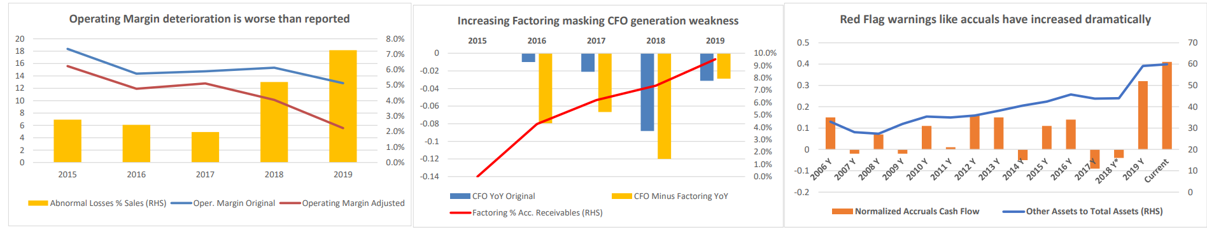
Red Hat acquisition is overvalued echoing a terrible M&A track record that de-rated credit metrics. IBM acquired Red Hat for $34 bn in a 100% cash deal tantamount to +60% premium over Red Hat’s market price (announced in October 2018). The deal valuation can be considered rather expensive (table below) reflecting IBM’s angst of missing out another opportunity similar to the public cloud. Moreover, IBM’s M&A track record speaks by itself with the firm’s Equity minus Goodwill spread pointing out a dramatic historical destruction of value for shareholders (second chart below) and a huge burden in terms of intangible over market cap (+50%) that anticipates looming goodwill impairment risk. Worse yet, IBM has increased its leverage significantly after financing 66% of the deal via $ 20bn bond issuance. Although IBM’s Interest cover (6x) and Altman-Z (4.5x) are in safe territory, the credit metrics have de-rated IBM’s credit profile from Investment Grade to High Yield (third chart below) leaving no margin of safety in these Covid19 times. Lastly, IBM’s CDS has recently spiked in late September breaking the stable trend traced since the issuance of the bonds in 2019, which can be interpreted as a red flag that in the past has eventually impacted a company’s stock price. 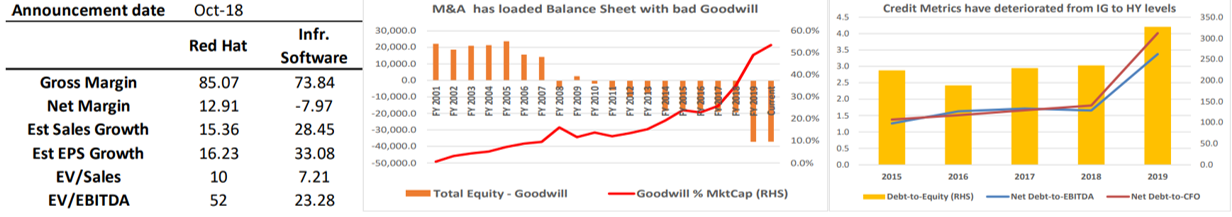 New CEO is neither shaking things up nor bringing back Big Blue’s glory days. IBM has changed CEO three times over the last decade with all of them following the same script of overpromising and underdelivering either organically (e.g. Watson) and non-organically (e.g. terrible M&A track record). Things are not going to be different this time. Firstly, New CEO Arvind Krishna is a 30-year veteran (58 years old) at IBM whose first message was identical to his predecessor (focus on hybrid cloud, importance of the legacy business). In contrast, Microsoft’s CEO Satya Nadella changed his firm’s culture from the first year by exposing problems, exhibiting corporate self-criticism and acknowledging mistakes i.e. writing down the $7.6 bn acquisition of Nokia's smartphone. None of this has happened at IBM with the appointment of its new CEO despite bulls claiming this turnaround case to be following Microsoft’ssteps. Secondly, IBM is a significant R&D laggard ($5.9bn, 7.5% revenue) compared to IT Infrastructure Peers (23.2%) or other large IT firms like Microsoft ($12.3bn, 13.5% sales), Google ($26bn, 16% sales) or even Oracle ($6.1bn, 15.5%). More concerning is the fact that IBM’s R&D budget has shrunk since 2011 ($5.9bn 2019 vs $6.2bn 2011). Thirdly, talent retention is essential in the industry and an uphill struggle for IBM. Research has found Glassdoor data useful to generate long/short alpha, particularly employee’s ratings upon “career opportunities” and “CEO opinion”. In this way, IBM is terribly underperforming key peers and underpaying by 15-20% in sales-generating key roles 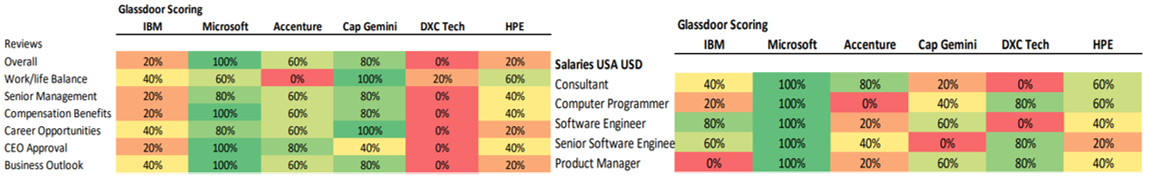 IBM is not too big to fail anymore with plenty of accounting red flags Several irregularities have been already highlighted earlier i.e. M&A value destruction, frequent segment reporting changes hiding structural problems, misleading cloud statements, increasing balance sheet risk and intangible impairment risk. After running further in-depth forensic accounting analysis, it’s clear the quality scoring of the firm is very poor with many additional red flags:
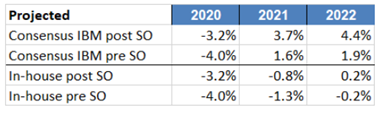
 IBM’s Dividend Yield is not telling the whole story. The percentage of IBM shares owned by income/dividend investment mandates is significantly high (~30% market cap vs ~10-20% IT Industry) as income-driven institutional investors have few places to hide after many companies cancelled dividends due to Covid19. Even after this artificial demand flowing into IBM, the shares have been trading laterally since April’s market rebound. The reality is that IBM’s dividend coverage ratio has deteriorated from 6-5x to 1.6x and, worse yet, the firm’s dividend plus buyback yield is now dramatically reduced as stock repurchases have been limited from +$4bn to ~$ 1bn as IBM has to face debt commitments. Moreover, a weaker credit profile and financial leverage turns IBM into a holding where income investors might probably stay until either other healthier stocks resume dividends, or IBM issues another profit warning. The second scenario would trigger an income-driven investor sell-off stampede similar to other “dividends at risk” stories in the past like Pearson Plc. Consensus pricing already a rosy turnaround story. Consensus expects IBM to deliver a flattish 3-year Sales CAGR with FY21/22 top-line growth between 1.5-2%, which is very optimistic bearing in mind recent mid-single negative growth rates pre-Covid19. That said, the sell-side figures rely on IBM-excluding-Red-Hat’s ability to deliver hybrid cloud growth, and macro IT expenditure trends to remain intact in 2020-2021, which doesn’t seem to be the case as the chart below Red Hat’s growth is assumed to be at +15% CAGR. Moreover, consensus is also excessively optimist with current asset disposals and gross margins as the second charts shows. For your information, “in-house” represents my estimates) taking current gross margins and factoring consensus sales growth and sales mix per business segment. 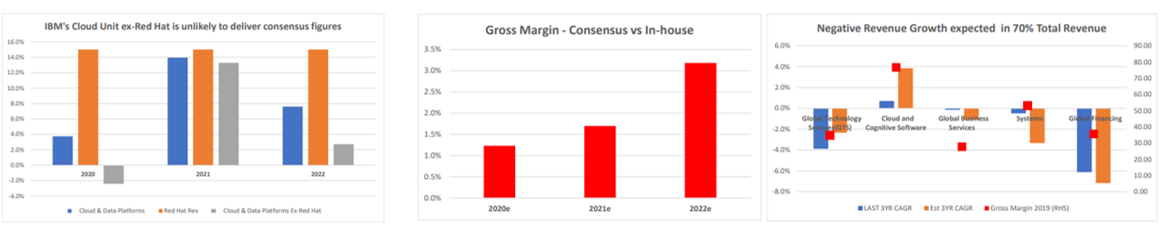 IBM valuation is pricing a significant probability of turnaround. The firm is currently discounting some premium using 5-year historical valuation metrics (e.g. Fwd EV/EBITDA 8.9x vs 8.5x 5YR Average). Regarding IBM’s relative valuation premium to peers, the shares are pricing a low single-digit valuation discount using multiple ratios (e.g. Fwd PE 31% discount vs 27% discount 5YR average). The odd one out is Price-to-book showing a +significant discount (30% using IBM 5-year average and +44% using IBM-Peers historical PTB gap), yet IBM’s book value is unreliable due to the inflated intangible levels mentioned earlier. Bottom line, IBM is not showcasing a deep valuation discount that could attract mean-to-reversion traders. In addition, the next tables display bearish scenarios yielding a downside from -4% to -50% using recently observed (last 5 years) valuation ratios during times when IBM has disappointed: 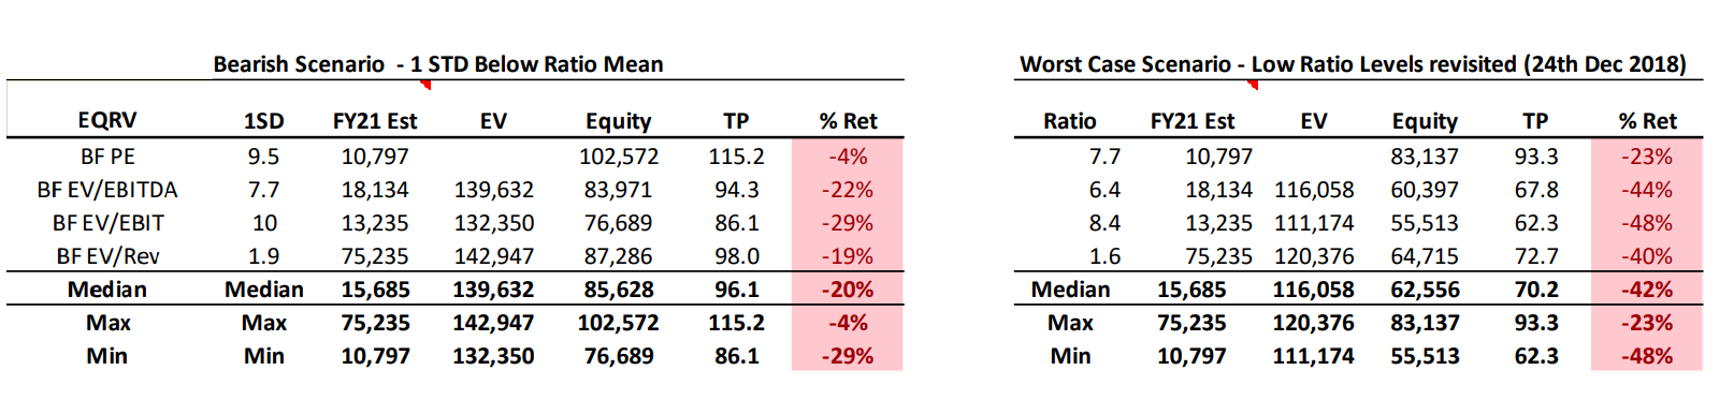 Another approach is to use Red Hat’s implied ballpark valuation figure of $45.5bn USD using Covid19 software valuation re-rating for US Infrastructure Software firms (+~34% PER expansion since 2018). Using pre-deal IBM valuation (~$113.9bn) and adding a Red Hat valuation expansion since 2018 of +$11.5bn (gap between $45.5bn and $34bn price tag or ~$12.9 per IBM share) yields a total IBM valuation of $141 bn or $140 per share under the assumption that IBM ex-Red Hat has not deteriorated since 2018 and Covid19 IT premium will remain in the long term, which are unrealistically bullish assumptions. Last but not least, a 2-stage DCF model was tested with reasonable inputs (WACC 8.5%, 2% long term growth) with similar results i.e. consensus bull scenarios (+3% short term sales growth and +300 bps margin expansion) delivering TP ranges of $130-140 per share, whereas bear scenarios (<2% growth and +200bps margin) yielded TP ranges below $100. That said, IBM’s characteristics (e.g. negative top line growth) are not appropriate when applying a DCF model, for which reason the valuation approach initially proposed using ratios can be more reliable this time. The spin-off announcement doesn't change anything. IBM released the 8th October the next spin-off announcement:
 Bullish sell-side and buy-side analysts argue that IBM will be able to kick out a significant part of their leverage to the newco, yet this rationale is flawed as tax code changes has made more difficult to use spin-off's stub companies to unload debt:
Last but not least, IBM bulls also compare the new spin-off with HPE's spin-off in 2015, yet the current situation is different and although at the time the spin-off allow the parent to hold up rather well; it didn't change the fate of the firm or the stub. In any case, a backtesting of past spin-offs in this industry has been conducted in order to assess the trading behaviour of the parent company during corporate events such as this. In this way, the backtesting analysis included completed IT spin-offs (excluding Semiconductors, ecommerce and other non-IBM related) for the last 20 years. The next table displays the total return and alpha (abnormal return) for different time windows after the spin off announcement calculated from every parent company: 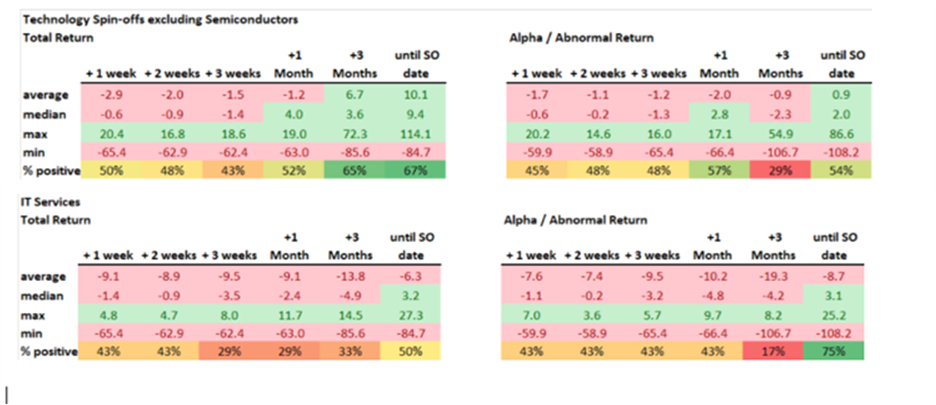 Bottom line, Tech ex-semis and IT services parent companies announcing spin-offs deliver negative absolute returns and alpha in the short run. As this research and other popular spin-off papers released by other authors show, It seems things get better one or two months before the spin-off. That said, these results should be taken with a pinch of salt as the sample suffers of selection bias, small sample bias (22 names) and survival bias.
IBM Short Thesis Risks:
Short Trade Management:
0 Comments
Leave a Reply. |

Carlos Salas
LINKS Data Science & ML NYC Data Science Blog Data Science Central Towards Data Science Kaggle Blog Analytics Vidhya Quant Finance Quantocracy MoneyScience QuantStrat Trade R Investments Market Screner Macro Calendar Corporate Calendar Advisor Perspectives Trading Economics Portfolio Visualizer Datasets Opendata Data.Gov World Bank Quandl |
 RSS Feed